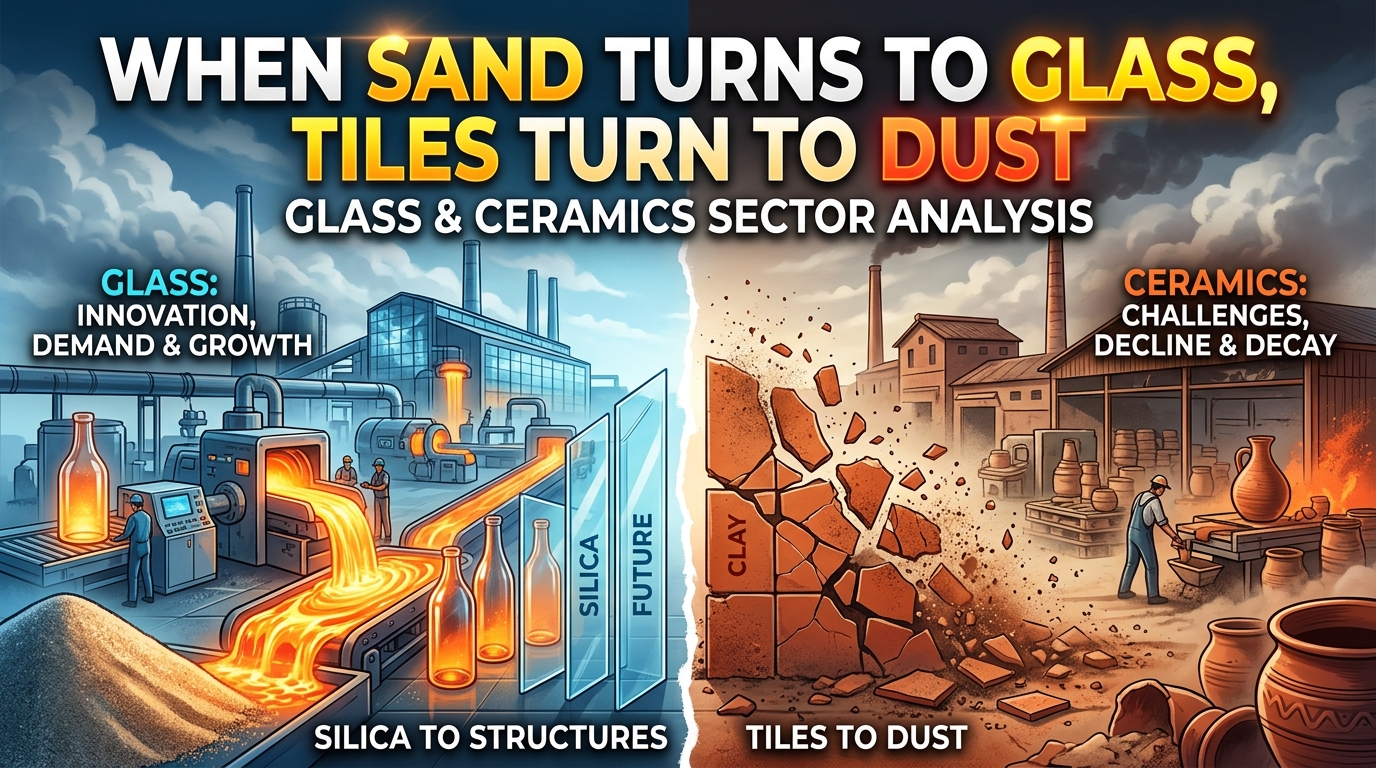
When Sand Turns to Glass, Tiles Turn to Dust
A plain-English guide to why Pakistan's glass makers are printing profits while the ceramics and tile makers next door are bleeding cash
Imagine you are renovating a house in Lahore. You walk into a shop to buy bathroom tiles and a bedroom mirror on the same afternoon.
The mirror shop owner is smiling. His supplier just raised prices again, and he is still selling out every week. The tile shop owner is not smiling. He is quietly discounting last year's stock because a container of cheaper Chinese tiles just landed at Karachi port, and his own factory back home is losing money on every box it makes.
Same broad “glass and ceramics” sector on the stock exchange. Same tough economy. Completely opposite outcomes.
Here is why — and what the actual numbers say.
Section 1 — Two Businesses Wearing One Sector Badge
On the Pakistan Stock Exchange, glass companies and ceramics/tile companies are often bundled together into one "Glass & Ceramics" sector. That is a bit like putting a bakery and a car mechanic in the same category just because both use ovens.
Glass makers — Ghani Glass, Tariq Glass, Ghani Value Glass, Ghani Global Glass — sell float glass (windows, mirrors), containers (bottles, jars) and tableware. They compete mainly against each other in a small club of about five or six serious local players.
Ceramics and tile makers — Shabbir Tiles, Frontier Ceramics, Karam Ceramics — sell floor and wall tiles. They compete not just with each other, but with a flood of cheap imported tiles from China, which years ago captured over half the local tile market.
That single difference — how much of the market imports can steal — explains most of the story you are about to read.
Section 2 — The Numbers Every Investor Should Actually Understand First
Before the company-by-company breakdown, here is what each column in the data table means, in plain words:
EPS (Earnings Per Share): the profit the company made for each single share you own. Higher and growing is good. A negative number means the company lost money.
P/E (Price-to-Earnings): the price you pay today for every Re. 1 of profit the company earns in a year. A lower P/E usually means the stock is cheaper relative to its profit — but only if that profit is real and growing.
Dividend Yield: the cash the company pays you every year, as a percentage of the share price. Think of it as the "rent" you collect just for holding the stock.
P/B (Price-to-Book): the price you pay compared to what the company would be worth if it sold everything it owns and paid off all its debts today. Above 1 means the market thinks the company is worth more than its raw assets.
ROE (Return on Equity): how efficiently a company turns shareholders' money into profit. If ROE is 20%, it means every Rs. 100 of shareholder money invested in the company earned Rs. 20 in profit that year.
With that out of the way, let's look at the two halves of this sector — starting with the one that is working.
Section 3 — The Glass Makers: Full Order Books, Strong Margins
2025 Annual Snapshot — Glass Companies
| Symbol | Company | Price (Rs.) | Market Cap | EPS | P/E | Dividend Yield | P/B | ROE |
| GHGL | Ghani Glass Limited | 41.44 | Rs. 41.47 B | 5.90 | 7.02 | 8.76% | 1.06 | 17.85% |
| TGL | Tariq Glass Industries | 177.99 | Rs. 30.77 B | 27.75 | 7.30 | 1.59% | 1.36 | 21.30% |
| GVGL | Ghani Value Glass | 54.49 | Rs. 8.32 B | 7.00 | 8.27 | 3.43% | 1.85 | 21.24% |
| GGGL | Ghani Global Glass | 8.10 | Rs. 1.96 B | 1.25 | 14.37 | 0.00% | 0.68 | 4.46% |
| BGL | Baluchistan Glass | 10.10 | Rs. 6.40 B | -1.85 | — | 0.00% | — | — |
Look closely and a pattern jumps out: every profitable glass company here has a Return on Equity above 17%. That is a genuinely strong number for a manufacturing business in Pakistan. TGL and GVGL are both above 21% — meaning for every Rs. 100 shareholders put in, the company is generating over Rs. 21 of profit a year.
Their P/E ratios are also low — mostly in the 6 to 8 range. In plain terms, the market is not asking investors to pay a big premium for this profit, even though the profit itself looks healthy. This can mean the stocks are undervalued, or it can mean the market is worried the good times won't last. We will get to which one it is.
GHGL stands out with an 8.76% dividend yield — a serious cash return, more than most bank savings accounts currently offer, layered on top of the stock itself.
The one exception in this table is Baluchistan Glass (BGL), which posted a loss of Rs. 1.85 per share in 2025. It sits apart from the other glass names — a reminder that being "in glass" does not automatically guarantee profit; scale, product mix, and cost control still matter enormously.
1. They are an oligopoly, not a crowded market. According to a December 2025 sector study by PACRA, Pakistan's glass industry has only about five to six major local players spread across three segments: float glass, tableware, and containers. Float glass alone — largely used for windows and mirrors — is dominated by just three companies: Tariq Glass, Ghani Glass, and Ghani Value Glass. When there are only three real competitors, it is much easier to raise prices without losing customers to a rival next door.
2. They can pass rising costs on to the customer. Sector-wide gross profit margins actually rose to about 29.1% in FY25, even though the volume of glass produced physically fell by roughly 36% year-on-year. How can profit margins go up while production drops? Because manufacturers raised prices faster than costs rose, and energy costs and raw material costs actually fell by about 17% and 14% respectively during the year. Fewer units sold, but each unit was more profitable — the opposite of what happened to the tile makers, as you'll see shortly.
3. Imports cannot easily replace them in their core segments. Glass is heavy, fragile, and expensive to ship. While Pakistan does import a meaningful amount of specialty glass (glass fibres, pharmaceutical-grade glass, some containers), the bulk float glass and tableware segments — where the big listed names operate — are much better protected from foreign competition than tiles are. Local glassmakers essentially have the home-court advantage on their biggest product lines.
Section 4 — 2026 So Far: Who Is Actually Improving?
The table below shows expected quarterly EPS for 2026 (Q1 through Q4, where reported), based on results issued through the year.
| Symbol | Q1 | Q2 | Q3 | Q4 (Est.) | Sum of Quarters | 2025 Full-Year EPS | Direction |
| TGL | 5.14 | 5.56 | 6.42 | 5.71 | 22.83 | 27.75 | Down ~18% |
| GVGL | 1.26 | 1.73 | 2.17 | 1.72 | 6.88 | 7.00 | Roughly flat |
| FRCL | 1.17 | 1.37 | 2.36 | 1.63 | 6.53 | 3.89 | Up ~68% |
| GGGL | 0.10 | 0.11 | 0.08 | 0.10 | 0.39 | 1.25 | Down ~69% |
| BGL | -0.20 | -0.18 | -0.19 | -0.19 | -0.76 | -1.85 | Loss narrowing |
| STCL | -0.80 | -1.53 | -1.45 | -1.26 | -5.04 | -0.80 | Loss widening sharply |
| KCL | — | — | — | — | Data unavailable | -50.50 | Unknown |
| REGAL | — | — | — | — | 0.00 (winding up) | — | Exiting the market |
Note: GHGL's full 2026 figures had already been released at the time of this data pull, so it is left out of this projection table to avoid double-counting — its annual 2026 EPS came in at Rs. 7.23. Refer to the FY25 table above for its most recent audited numbers, where its FY25 EPS stands at Rs. 5.90. KCL has not disclosed enough 2026 data to build a full estimate, and REGAL is in the process of winding up operations entirely.
Tariq Glass (TGL) is actually cooling off. Its quarterly EPS trend for 2026 adds up to roughly 18?low its full 2025 EPS. This does not mean the company is in trouble — its Q3 print of Rs. 6.42 is still strong — but it is a signal that the exceptional 2025 margins may be normalizing. Investors should watch whether this is a temporary dip or the start of a slower growth phase.
Frontier Ceramics (FRCL) is the surprise outperformer of the entire sector. Despite technically sitting in the "ceramics" bucket, FRCL's 2026 numbers are tracking about 68?ove its full-year 2025 EPS. This is worth flagging clearly: not every ceramics company is struggling. FRCL appears to be finding a profitable niche even while its tile-making peers post steep losses — worth digging into separately for what it is doing differently (its 2025 ROE of 7.67% was modest, so this improvement, if it holds, would be a meaningful re-rating for the company).
Section 5 — The Ceramics and Tile Makers: A Much Rougher Picture
2025 Annual Snapshot — Ceramics & Tile Companies
| Symbol | Company | Price (Rs.) | Market Cap | EPS | P/E | Dividend Yield | P/B | ROE |
| FRCL | Frontier Ceramics | 89.00 | Rs. 3.37 B | 3.89 | 13.32 | 0.00% | 1.75 | 7.67% |
| STCL | Shabbir Tiles & Ceramics | 10.30 | Rs. 2.46 B | -0.80 | — | 0.00% | — | — |
| KCL | Karam Ceramics | 144.13 | Rs. 2.01 B | -50.50 | — | 0.00% | — | — |
| REGAL | Regal Ceramics | 3.80 | — | — | — | — | — | Winding Up |
This table looks dramatically weaker than the glass table above it — and the numbers back that up. Three of four names here either lost money in 2025 or are exiting the business entirely.
Karam Ceramics (KCL) posted an EPS of negative Rs. 50.50 — an enormous loss relative to its share price of Rs. 144.13. A loss this large per share, against a market cap of only about Rs. 2 billion, usually points to a major one-off write-down (such as writing off old machinery or inventory) rather than ordinary operating losses. Its P/B and ROE cannot even be meaningfully calculated because of this.
Regal Ceramics (REGAL) is winding up — meaning the company is shutting down and liquidating its assets. This is the clearest possible signal of how brutal competitive conditions have been in the tile-making segment.
Shabbir Tiles (STCL), one of Pakistan's oldest tile makers (founded in 1978, first private ceramics enterprise in the country), posted a loss in 2025 and, based on the quarterly trend in the table above, its 2026 losses are tracking worse — not better.
Why Is the Tile Business So Much Harder Than the Glass Business?
The enemy is imports — and it has been for over a decade. A PACRA sector study on the ceramic tile industry found that the market share held by imported tiles — mostly from China, entering under a free-trade agreement — jumped from about 25% in FY13 to 52% in FY17. That means, even years ago, more than half of all tiles sold in Pakistan were already coming from abroad. Local tile factories have to compete on price against a country that can manufacture and ship tiles more cheaply than they can produce them at home.
Construction demand has been genuinely weak. Both glass and tiles depend heavily on construction activity, but tiles are typically one of the last things bought in a building project — after cement, steel, and structure are already in place. When construction slows and buyers cut corners on budgets, tile spending is often one of the first things trimmed or downgraded to a cheaper import.
There is less pricing power to hide behind. Unlike the glass oligopoly, the tile market has many more competing brands (Master Tiles, Sonex, RAK Ceramics, National Tiles, and others) fighting for the same shrinking pool of local demand, on top of the flood of imports. That makes it much harder for any single local tile maker to simply raise prices to protect margins the way glass companies have.
Section 6 — But It Is Not All One-Sided
To be fair to both sides of this story:
Glass has its own soft spots. The sector's own production of glass plates and sheets — a direct measure of physical output — fell by about 36% in FY25 alone, and kept declining into FY26. Profits held up because prices rose, not because the underlying business is booming in volume terms. Working capital days (essentially, how long cash is tied up in unsold inventory and unpaid customer bills) have also been stretching out, from an average of about 48 days over the past five years to 101 days in FY25 — a sign that glass companies are increasingly having to offer generous credit terms to move their product, which puts pressure on cash flow even during "good" profit years.
Not every tile maker is doomed. As shown above, Frontier Ceramics is bucking the trend with strong 2026 momentum. This tells us the sector's problems — while real and structural — are not a death sentence for every player. Efficient, well-positioned companies can still carve out profitable niches even inside a struggling industry.
Energy costs remain a shared risk for both. Furnaces for both glass and ceramics need enormous, continuous heat, and fuel and utilities make up a large chunk of direct costs for the glass sector alone (around 34% in FY24, though this eased to 29% in FY25). Any spike in gas or electricity tariffs in Pakistan hits both glass and ceramics manufacturers hard, regardless of how strong their pricing power otherwise is.
Taxation has been rising for everyone. Net profit margins in the glass sector actually slipped slightly in FY25, even as gross margins rose, largely because of higher taxation following the removal of certain tax incentives and an increase in the super tax on industry. Good operating performance does not always make it all the way down to the bottom line.
So — Who Actually Wins?
If you are buying tiles for your bathroom, you are currently benefiting from cheap imports at the expense of a struggling local industry. If you are buying a mirror or a window, you are likely paying a bit more, because the local glass makers who supply it have real pricing power and are using it.
For an investor looking at this sector, the lesson is not "avoid ceramics, buy glass" as a blanket rule — Frontier Ceramics' 2026 numbers alone prove that would be too simple. The real lesson is to look past the sector label and check three specific things for any company in this space: how exposed it is to cheap imports, how much genuine pricing power it holds in its specific product niche, and whether its profit growth is coming from real demand or just from raising prices on shrinking volumes.
The sector label says "Glass & Ceramics." The balance sheets say two completely different stories.
Sources
PACRA Research — “Sector Study: Glass”, 9 December 2025. pacra.com
PACRA Research — “Ceramic Tiles Industry Sector Overview”. pacra.com
Business Recorder — “Ghani Value Glass Limited: Performance and Outlook”, BR Research. brecorder.com
Business Recorder — “Ghani Value Glass Installs New Screen Printing Glass Project”, October 2025. brecorder.com
Mordor Intelligence — “Pakistan Container Glass Market Size & Share Analysis”. mordorintelligence.com
Ghani Glass Limited — Third Quarter FY2025-26 Financial Statements, PSX Data Portal. dps.psx.com.pk
Ghani Global Group — Corporate News & Announcements. ghaniglobal.com
Pakistan Stock Exchange (PSX) Data Portal — Company profiles for GHGL, TGL, GVGL, GGGL, BGL, STCL, KCL, FRCL. dps.psx.com.pk
Sector figures (EPS, P/E, Dividend Yield, P/B, ROE) as compiled from 2025 annual and 2026 quarterly company disclosures.
Disclaimer: This article is for general informational and educational purposes only and is not financial or investment advice.
The analysis is based on publicly available information and secondary research and does not constitute primary research.
Reasonable care has been taken to ensure the accuracy of the figures and calculations presented.
However, unintentional errors, omissions, or discrepancies may exist, and readers should independently verify the data with official sources.
Please conduct your own due diligence or consult a qualified, licensed financial advisor before making investment decisions.