
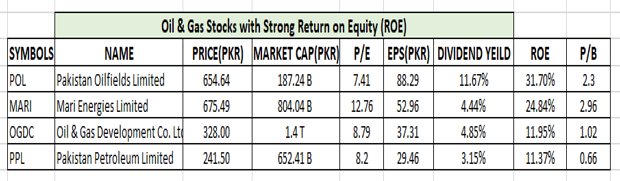
At first glance, Pakistan’s oil and gas sector looks straightforward, strong profits, solid dividends, and attractive valuations. But smart investing goes deeper than just reading numbers in a table. A comparison of Pakistan Oilfields Limited, Mari Energies Limited, Oil & Gas Development Company Limited, and Pakistan Petroleum Limited shows that each company tells a different story.
POL clearly leads in profitability with a ROE above 30% and an exceptional dividend yield near 12%. This signals a company that generates strong cash and rewards shareholders generously. Ideal for income-focused investors.
MARI, however, trades at a premium. Why? Because the market expects future growth. Its strong ROE and higher valuation suggest confidence in expanding production and earnings. This is where growth investors usually lean.
OGDC, being the largest player, offers stability and scale. Its near-book valuation and moderate returns make it a defensive choice, especially during uncertain market conditions.
PPL stands out as a deep value stock, trading below its book value. While returns are currently lower, it may offer upside if efficiency improves or gas pricing dynamics shift.
What Smart Investors Should Look Beyond These Numbers?
Financial ratios are just the starting point. In the oil & gas sector, you also need to watch:
- Production Growth: Are oil/gas output levels increasing or declining?
- Reserve Life: Companies with larger proven reserves have longer earning visibility.
- Global Oil Prices: Earnings are heavily linked to international crude prices.
- Government Policies: Pricing, taxes, and circular debt can impact profitability.
- Exploration Success: New discoveries can significantly boost future value.
- Exchange Rate Impact: Since revenues are often dollar-linked, currency movements matter.
A smart investor doesn’t just ask “Which stock is cheapest? “They ask “Which story makes the most sense for the future?”
Disclaimer:
This report is provided solely for information purpose only and we have tried to ensure the correctness of the figures but there may still be discrepancies, for further verification of data please do visit official websites. The company accepts no responsibility what so ever for any direct or indirect consequential loss arising from use of this report.

.png "Interest Rates vs PSX: Why Markets Fall When Rates Rise")
