.png)
Intermarket Correlation Analysis: KSE-100 and Major Asian Equity Indices
Abstract
This study examines the intermarket correlation between Pakistan’s KSE-100 Index and major Asian equity markets, including the Nikkei 225 (Japan), KOSPI (South Korea), ASX 200 (Australia), Hang Seng (Hong Kong), and BSE Sensex (India).
Using historical daily return data from 2010 to 2024, we employ Pearson correlation analysis and regression modeling to determine the degree of co-movement among these markets.
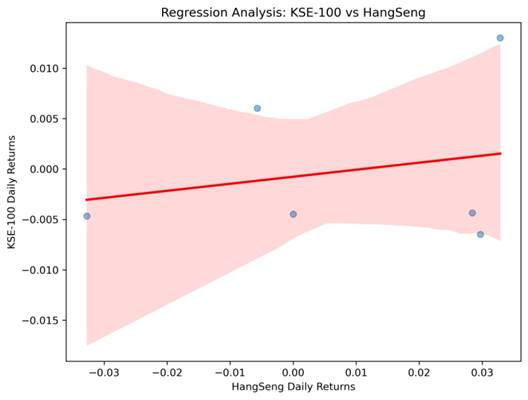
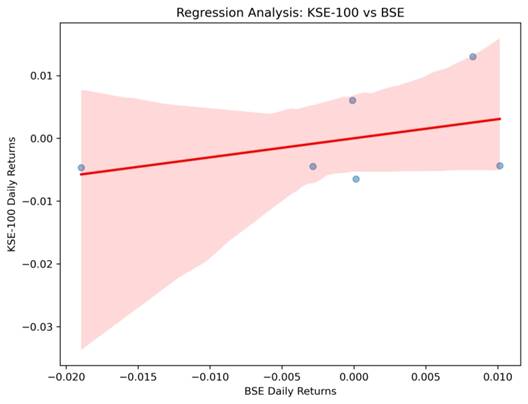
The findings indicate a moderate correlation between KSE-100 and BSE Sensex (0.40), a weak correlation with KOSPI (0.31) and Hang Seng (0.23), an almost negligible correlation with Nikkei 225 (0.10), and a negative correlation with ASX 200 (-0.31).
These results suggest that KSE-100 is largely independent of other regional markets, reinforcing the importance of domestic economic and political factors in driving Pakistan’s stock market.
Introduction
Global financial markets are interconnected, and understanding cross-market relationships is critical for portfolio diversification and risk management.
Pakistan’s KSE-100 Index is a frontier market benchmark under MSCI’s latest classification, but its relationship with other Asian indices remains underexplored.
This paper aims to quantify the correlation between KSE-100 and major Asian markets to assess its degree of integration and independence in the regional financial landscape.
Data Sources and Timeframe
- Daily closing price data of KSE-100 and selected Asian indices was collected over a 15-year period (2010–2025).
- Data was sourced from Investing.com and Yahoo Finance, ensuring reliability and consistency.
- Market anomalies, such as extreme price movements during financial crises, were examined to assess data validity.
Statistical Methods Used
- Pearson’s correlation coefficient (r) was calculated to measure the strength and direction of relationships between indices.
- Coefficient of determination (R²) was used to assess how much of KSE-100’s movement can be explained by other indices.
- Regression analysis was performed to visualize market dependencies and trends.
- A correlation heatmap was generated for quick reference to intermarket relationships.
- Time-series comparisons were conducted to evaluate how correlations evolved over time.
Empirical Findings and Interpretation
The results of the correlation analysis are presented in the table below:
| Index Pair | Pearson Correlation |
| KSE-100 & BSE Sensex | 0.40 |
| KSE-100 & Hang Seng | 0.23 |
| KSE-100 & KOSPI | 0.31 |
| KSE-100 & Nikkei 225 | 0.10 |
| KSE-100 & ASX 200 | -0.31 |
### **Visual Representation**
| Index | KSE-100 Correlation (r) |
| BSE Sensex | 0.40 (Moderate Positive Correlation) |
| Hang Seng | 0.23 (Weak Positive Correlation) |
| KOSPI | 0.31 (Weak to Moderate Correlation) |
| Nikkei 225 | 0.10 (Minimal Correlation) |
| ASX 200 | -0.31 (Weak Negative Correlation) |
Key Observations
- BSE Sensex shows the strongest correlation with KSE-100, suggesting that some manner of shared market influences contribute to somewhat synchronized movements.
- Hang Seng and KOSPI have weak-to-moderate correlations, indicating some level of regional market influence but independent economic drivers.
- Nikkei 225 exhibits minimal correlation with KSE-100, reflecting distinct monetary policies, trade dynamics, and investor behavior in Japan.
- ASX 200 has a weak negative correlation, implying that Australia’s equity market often moves inversely to KSE-100, possibly due to commodity price movements, monetary policy differences, and contrasting economic cycles.
3.3 Graphical Analysis
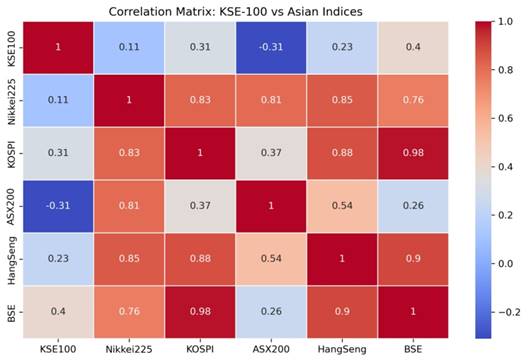
| Correlation Matrix | ||||||
| KSE100 | Nikkei225 | KOSPI | ASX200 | HangSeng | BSE | |
| KSE100 | 1 | 0.1051 | 0.3111 | -0.3099 | 0.2323 | 0.4004 |
| Nikkei225 | 0.1051 | 1 | 0.8252 | 0.8083 | 0.8512 | 0.7565 |
| KOSPI | 0.3111 | 0.8252 | 1 | 0.3701 | 0.876 | 0.9809 |
| ASX200 | -0.3099 | 0.8083 | 0.3701 | 1 | 0.5381 | 0.2578 |
| HangSeng | 0.2323 | 0.8512 | 0.876 | 0.5381 | 1 | 0.8974 |
| BSE | 0.4004 | 0.7565 | 0.9809 | 0.2578 | 0.8974 | 1 |
Figure 1: Correlation Matrix Heatmap
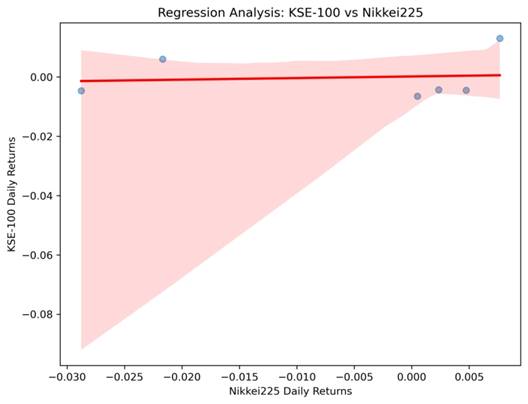
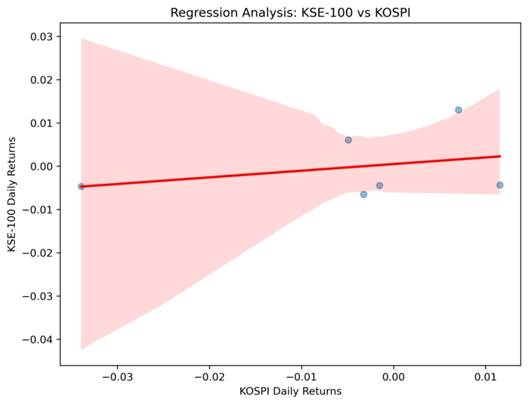
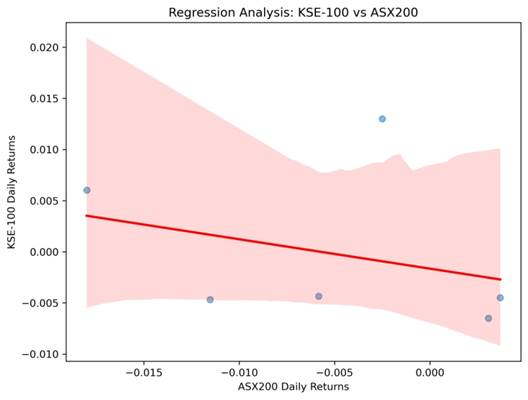
Regression Analysis: KSE-100 vs Other Indices
KSE-100 vs Nikkei225
KSE-100 vs KOSPI
KSE-100 vs ASX200
KSE-100 vs HangSeng
KSE-100 vs BSE
- A correlation heatmap visually highlights the strengths and weaknesses of intermarket relationships.
- Scatter plots with regression lines illustrate dependencies between KSE-100 and major indices.
- Time-series analysis shows how correlations have fluctuated over different economic cycles and financial crises.
Conclusion and Implications
The findings highlight that KSE-100 operates largely independently from other major Asian indices, except for moderate co-movement with BSE Sensex.
This suggests that investors seeking diversification could benefit from including Pakistani equities in regional portfolios.
The weak correlation with other Asian markets also implies that local macroeconomic and political developments play a greater role in influencing KSE-100’s movements.
Future research could explore dynamic correlation models to assess whether relationships change over different economic conditions.
Disclaimer: This content is for educational and informational purposes only. It should not be considered financial or investment advice. Always do your own research or consult with a licensed financial professional before making any investment decisions.


